Earth
ID: 5022
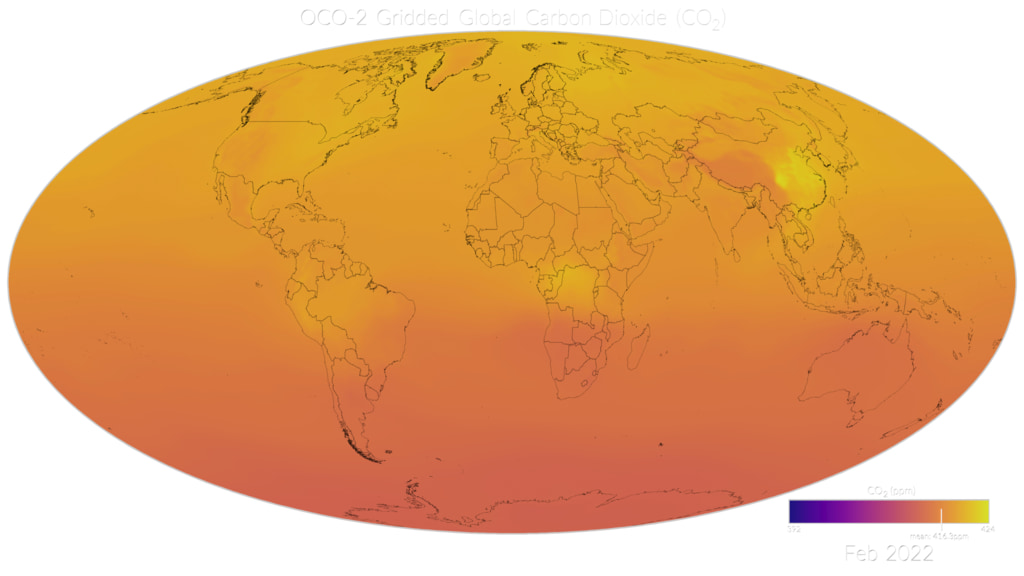
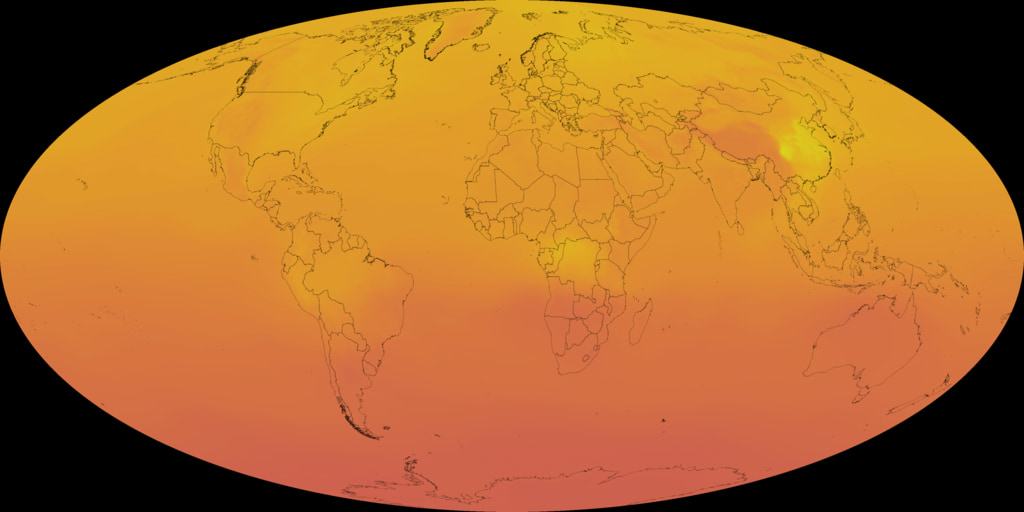
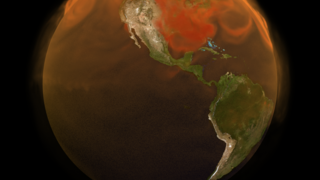
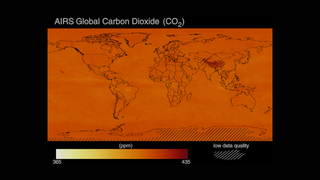
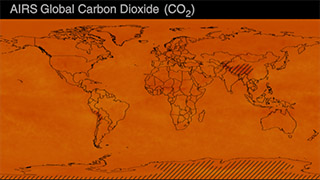
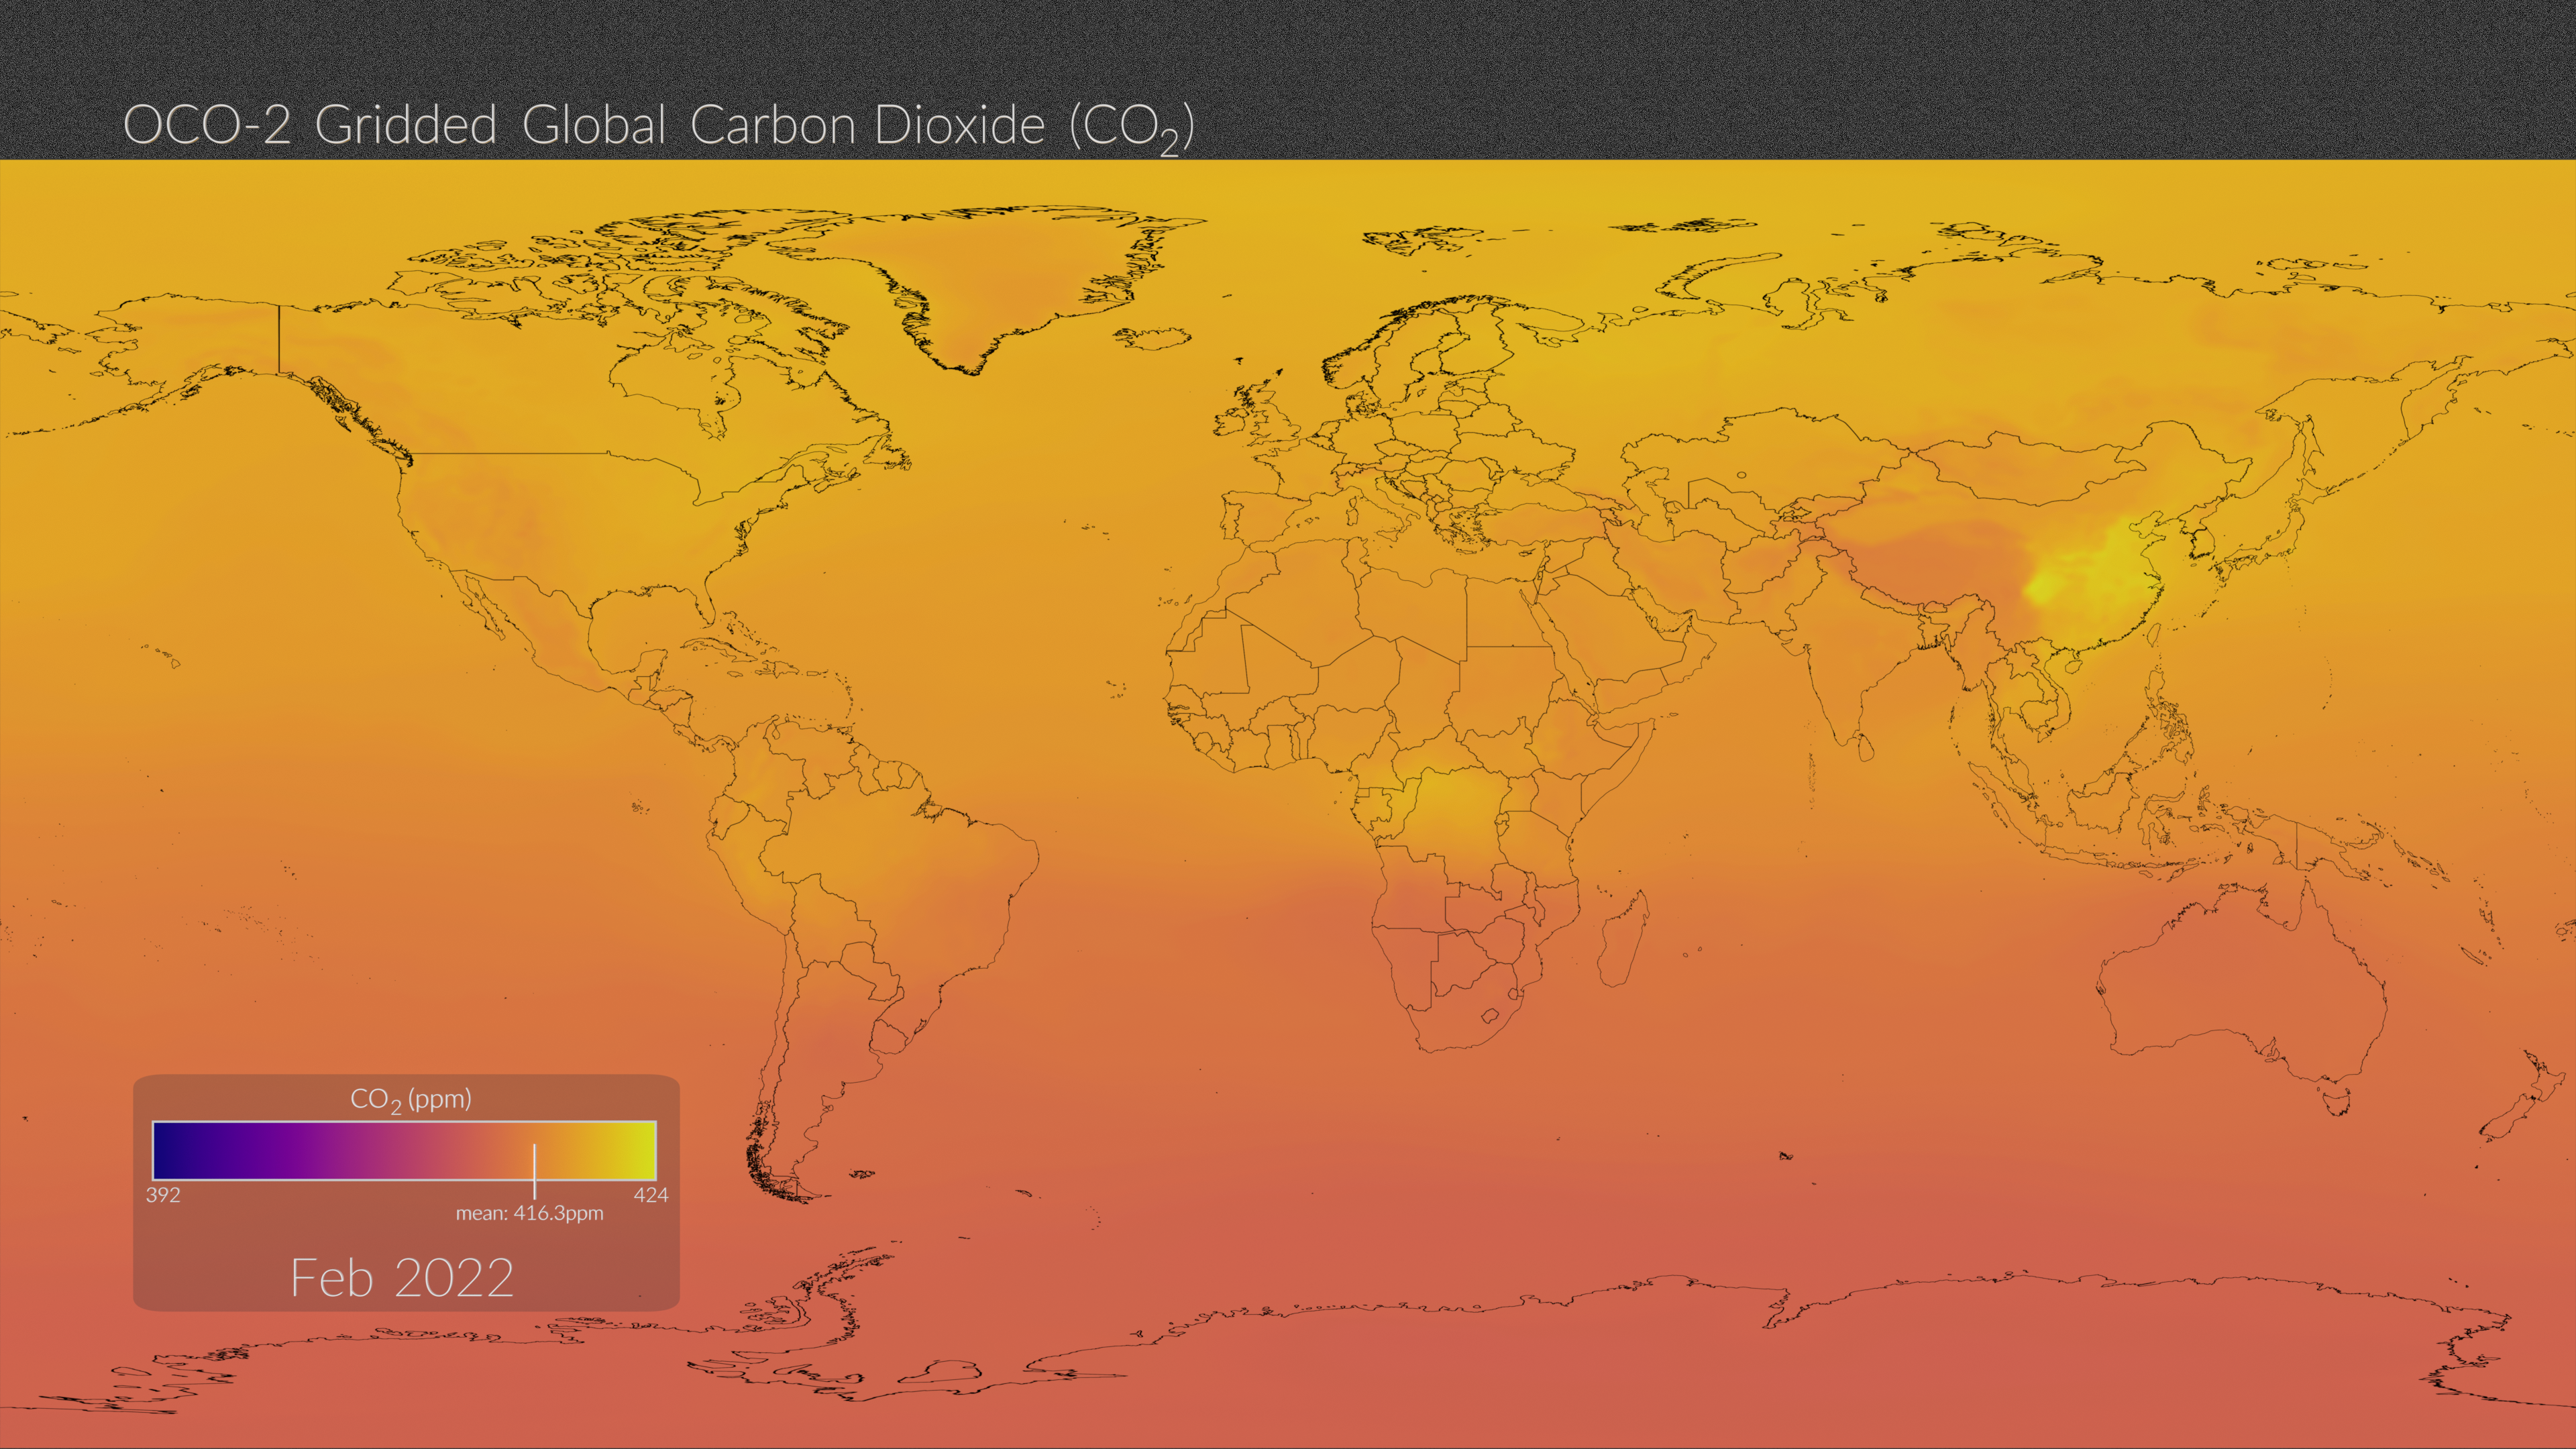
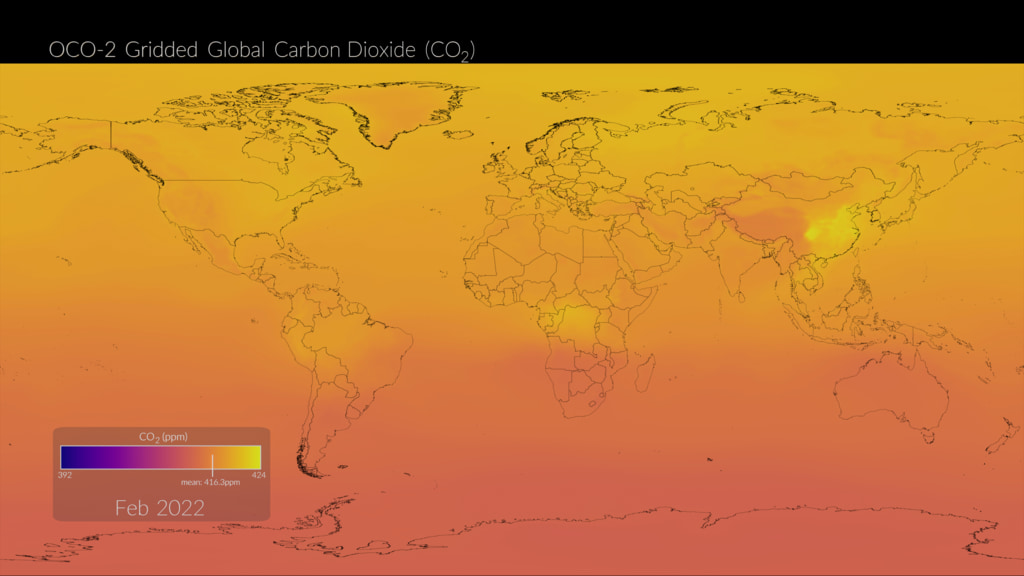
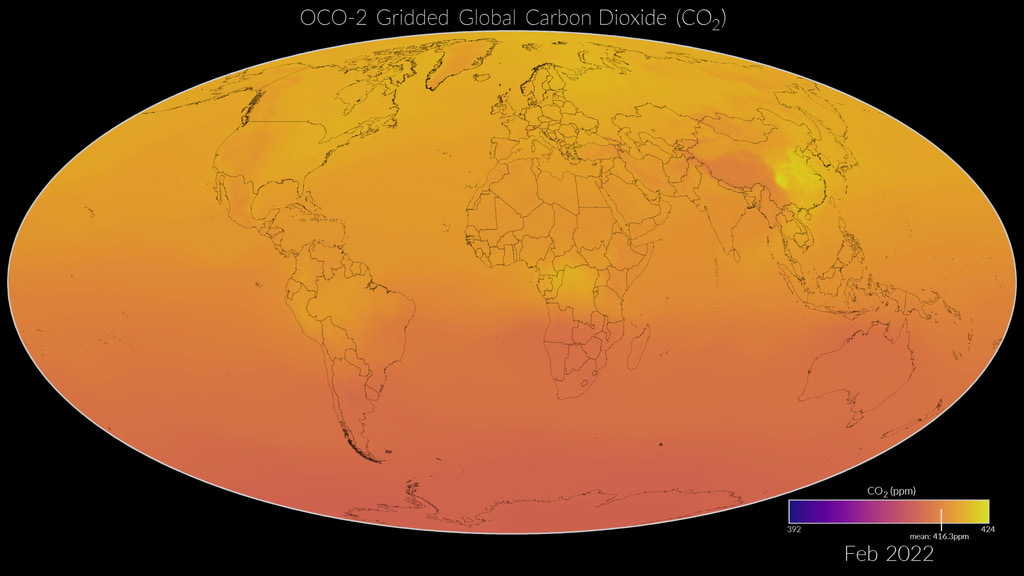
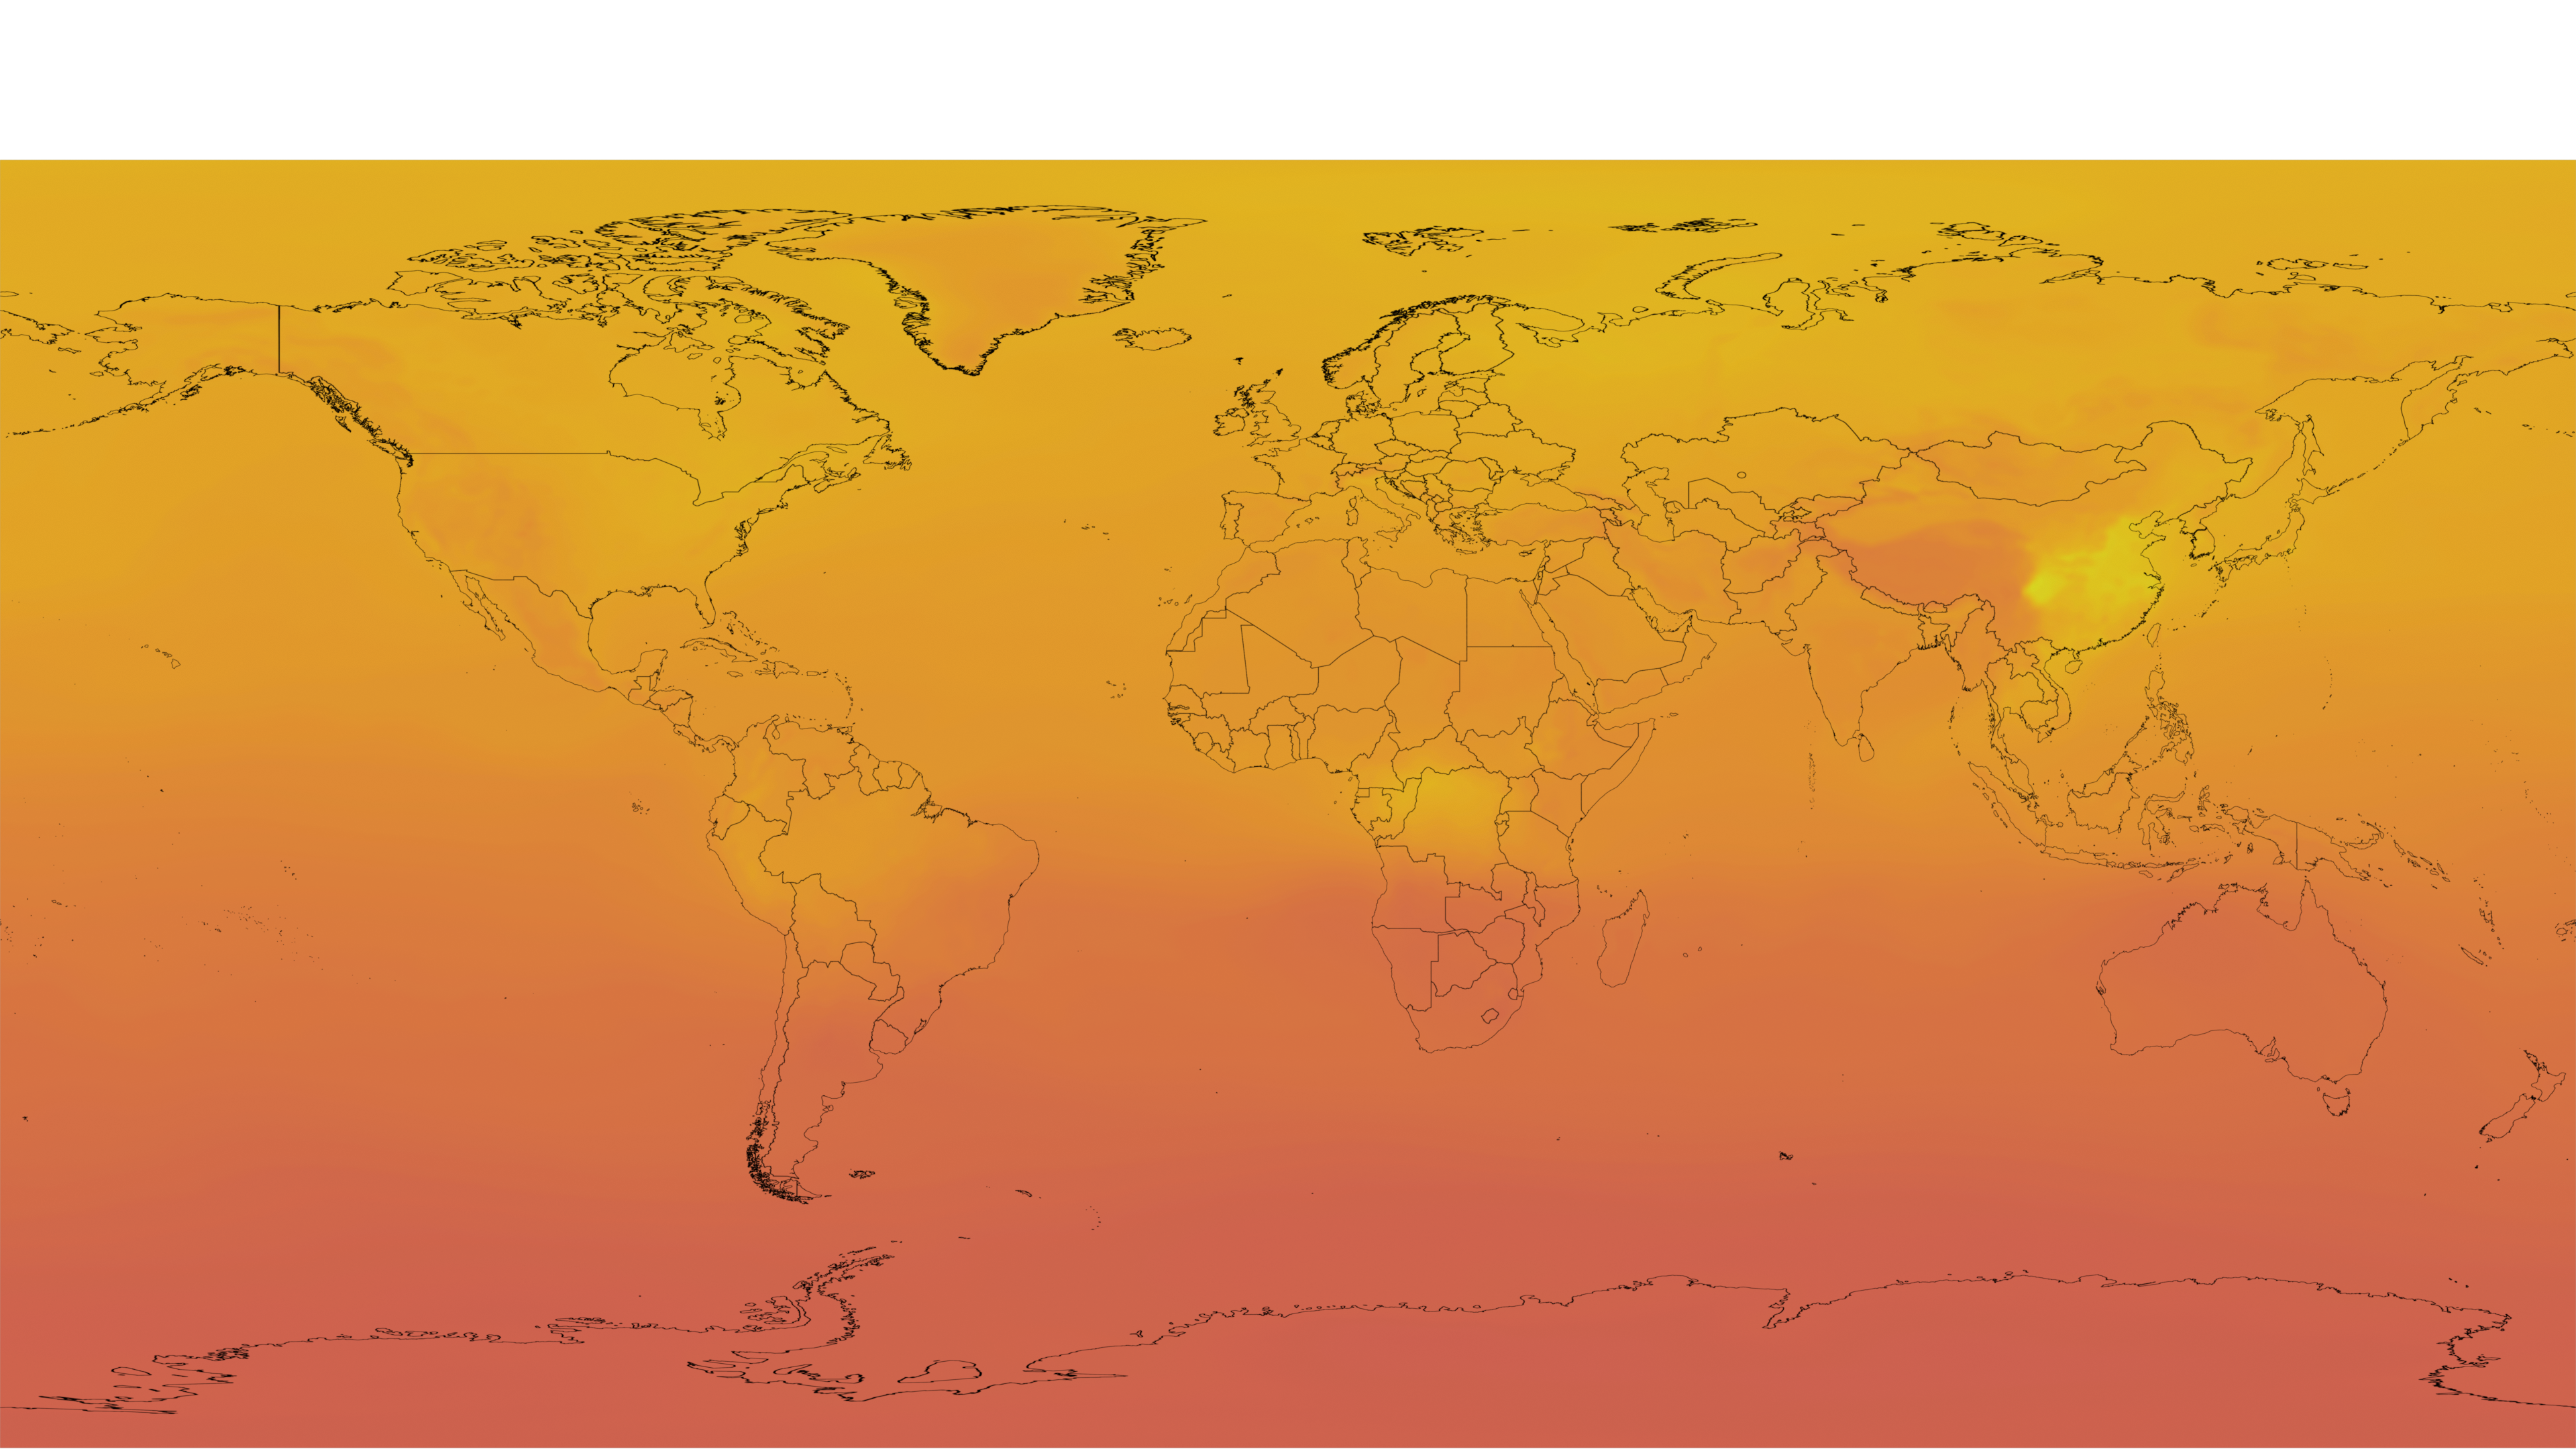
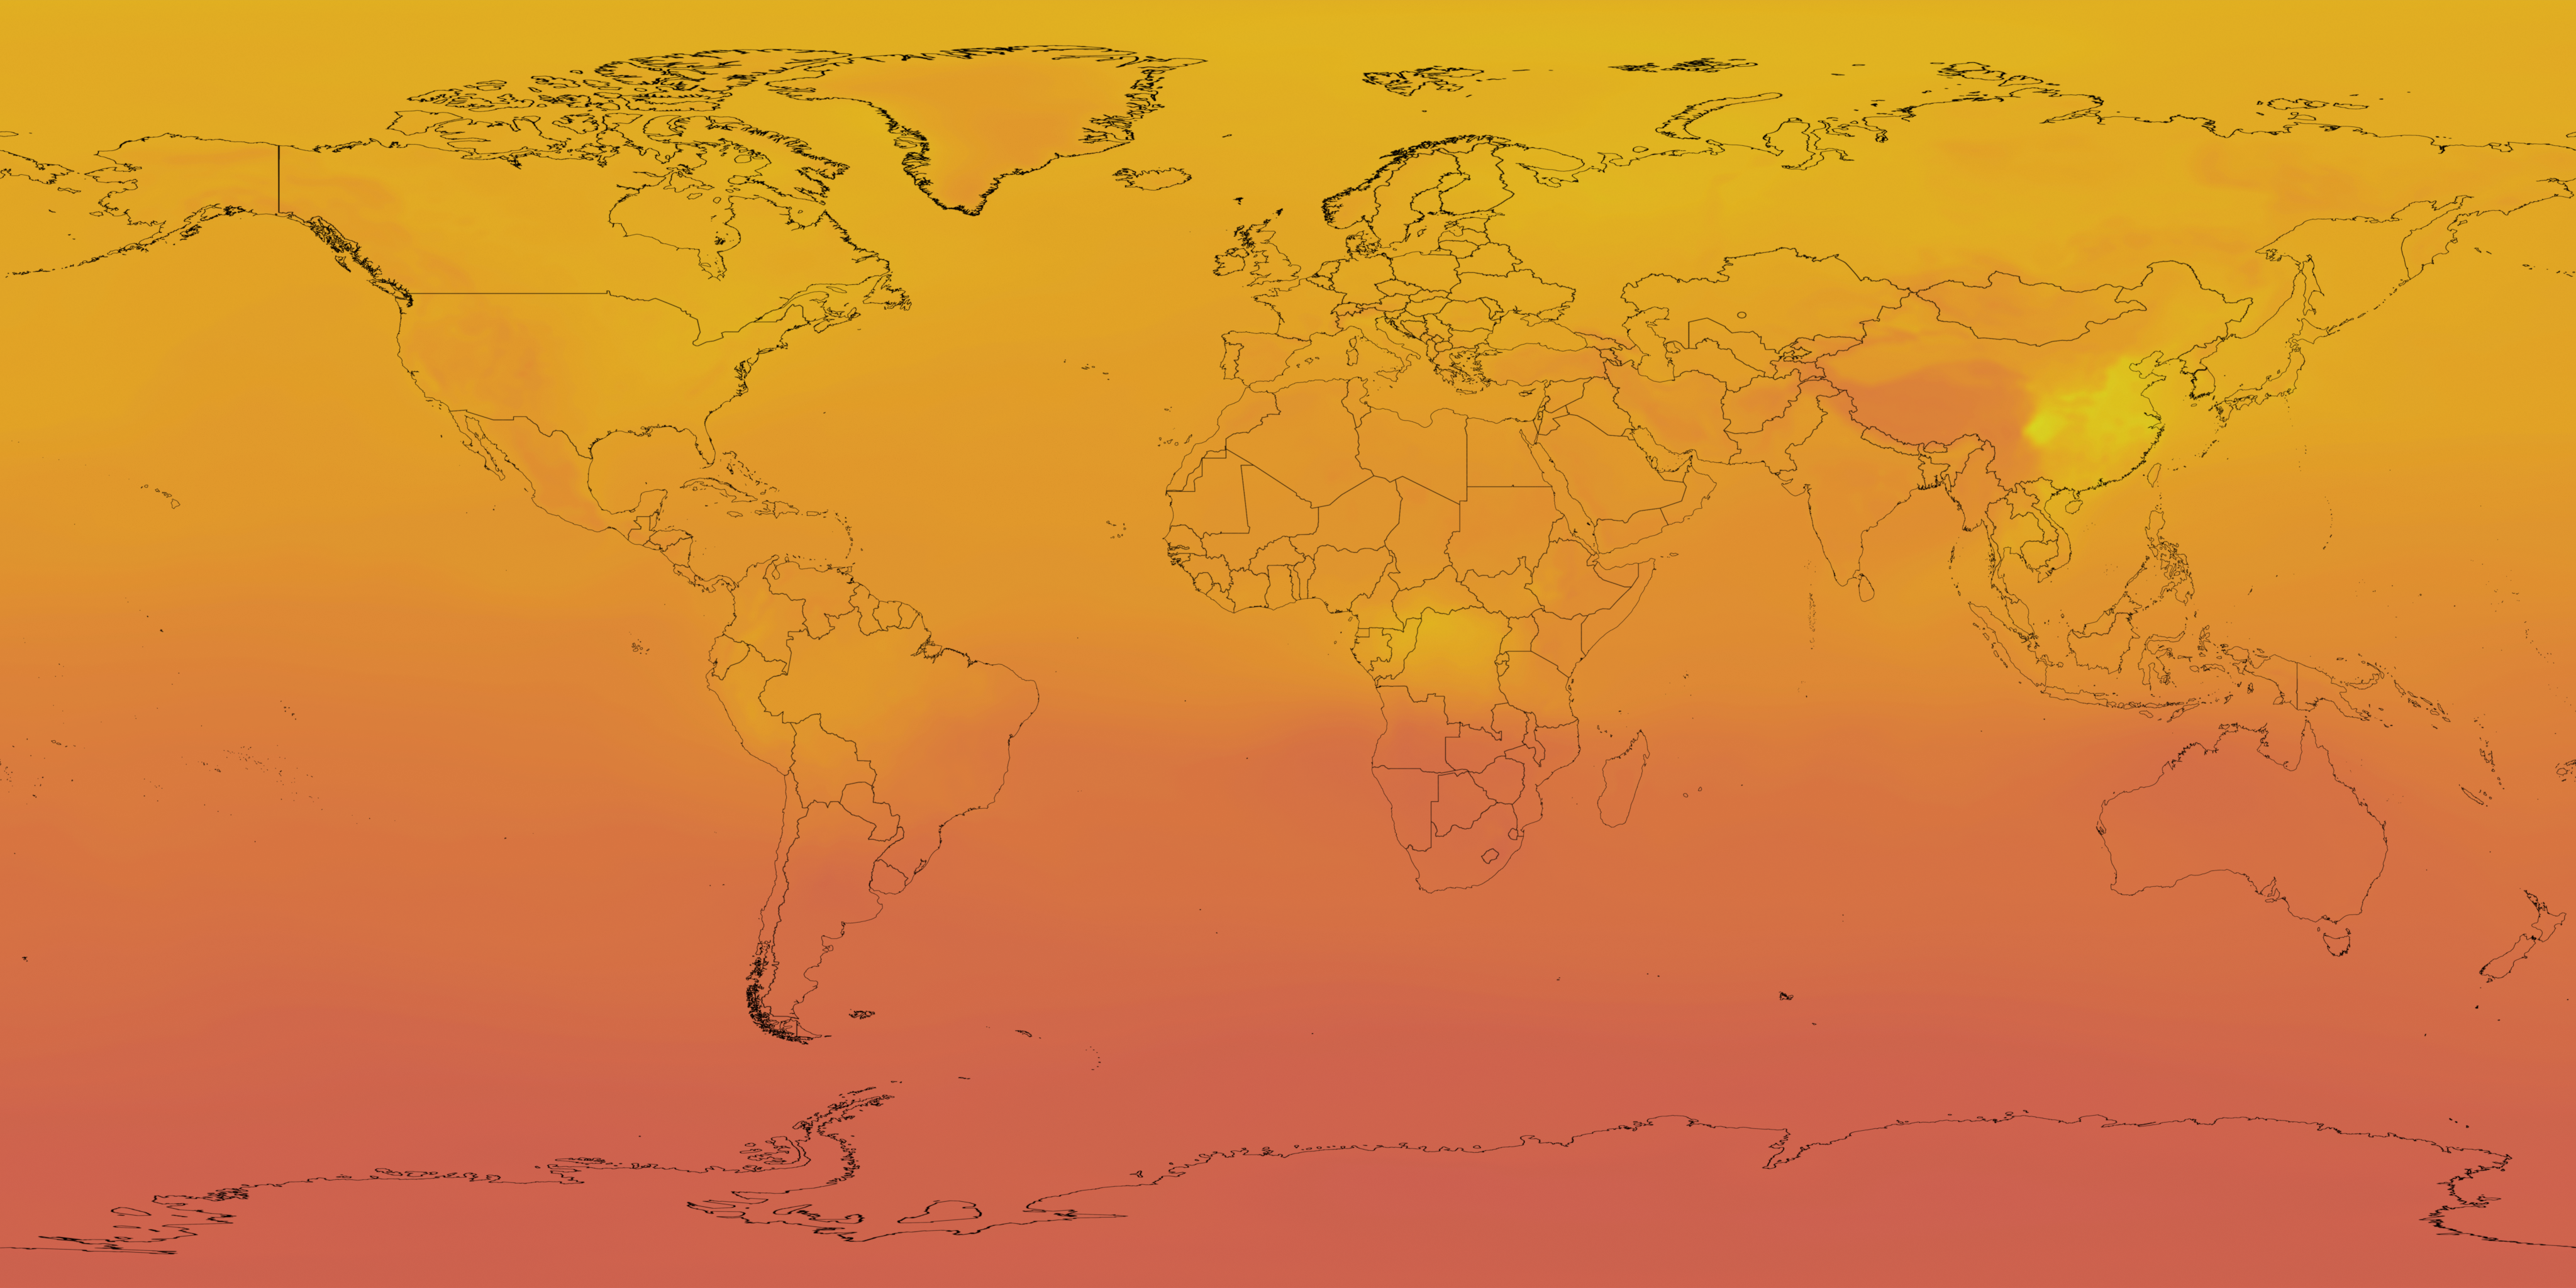
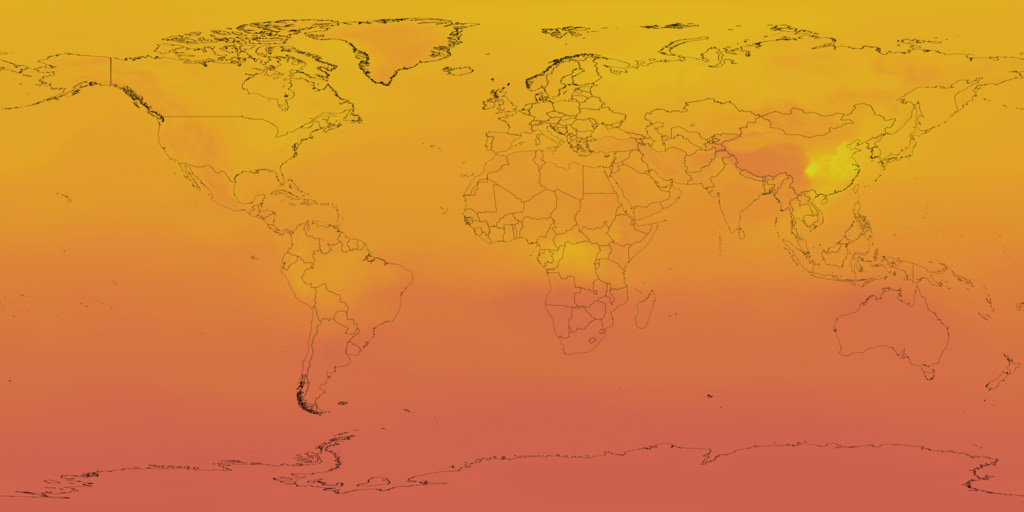
NASA’s Orbiting Carbon Observatory, 2 (OCO-2) provides the most complete dataset tracking the concentration of atmospheric carbon dioxide (CO₂), the main driver of climate change. Since its launch (July 2014), OCO-2 measures sunlight reflected from Earth’s surface to infer the dry-air column-averaged CO2 mixing ratio and provides around 100,000 cloud-free observations.
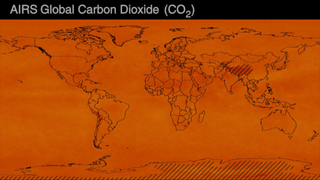
However, the OCO-2 data as observed by the on-board instrument have large data gaps in coverage due to the narrow 10-km ground track and an inability to see through clouds and aerosols. To provide a gap-filled view of Earth’s carbon cycle and atmosphere NASA’s Global and Modeling Assimilation Office (GMAO) ingests OCO-2 retrievals every 6 hours with a modeling and assimilation technique and derives the Gridded Monthly OCO-2 Carbon Dioxide/OCO-2 GEOS Level 3 product.
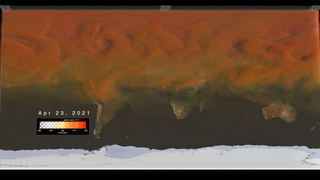
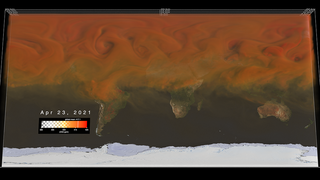
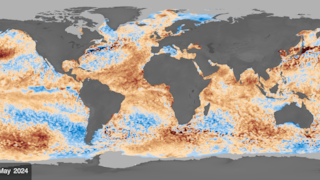
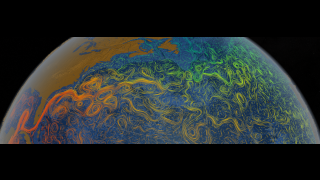
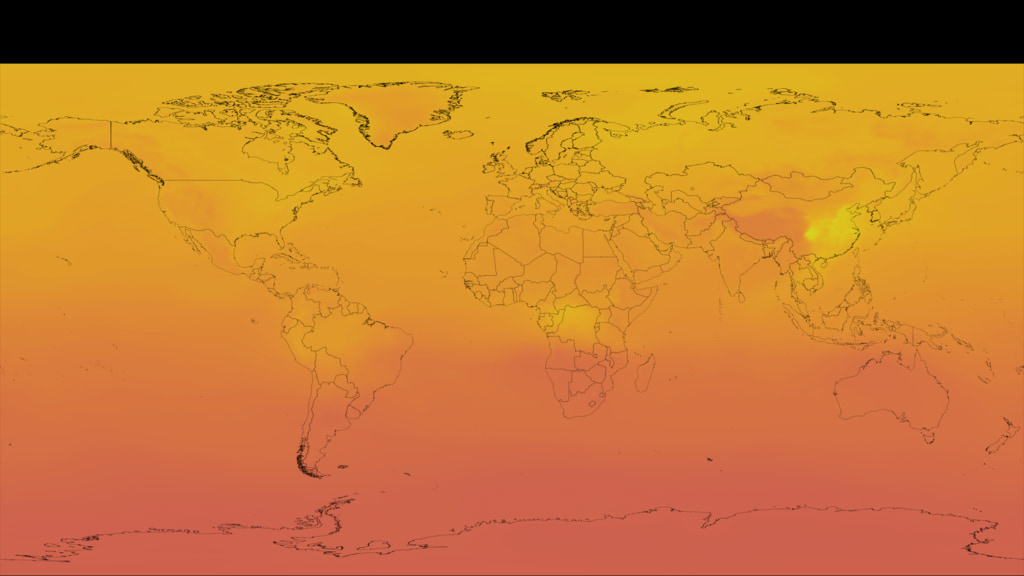
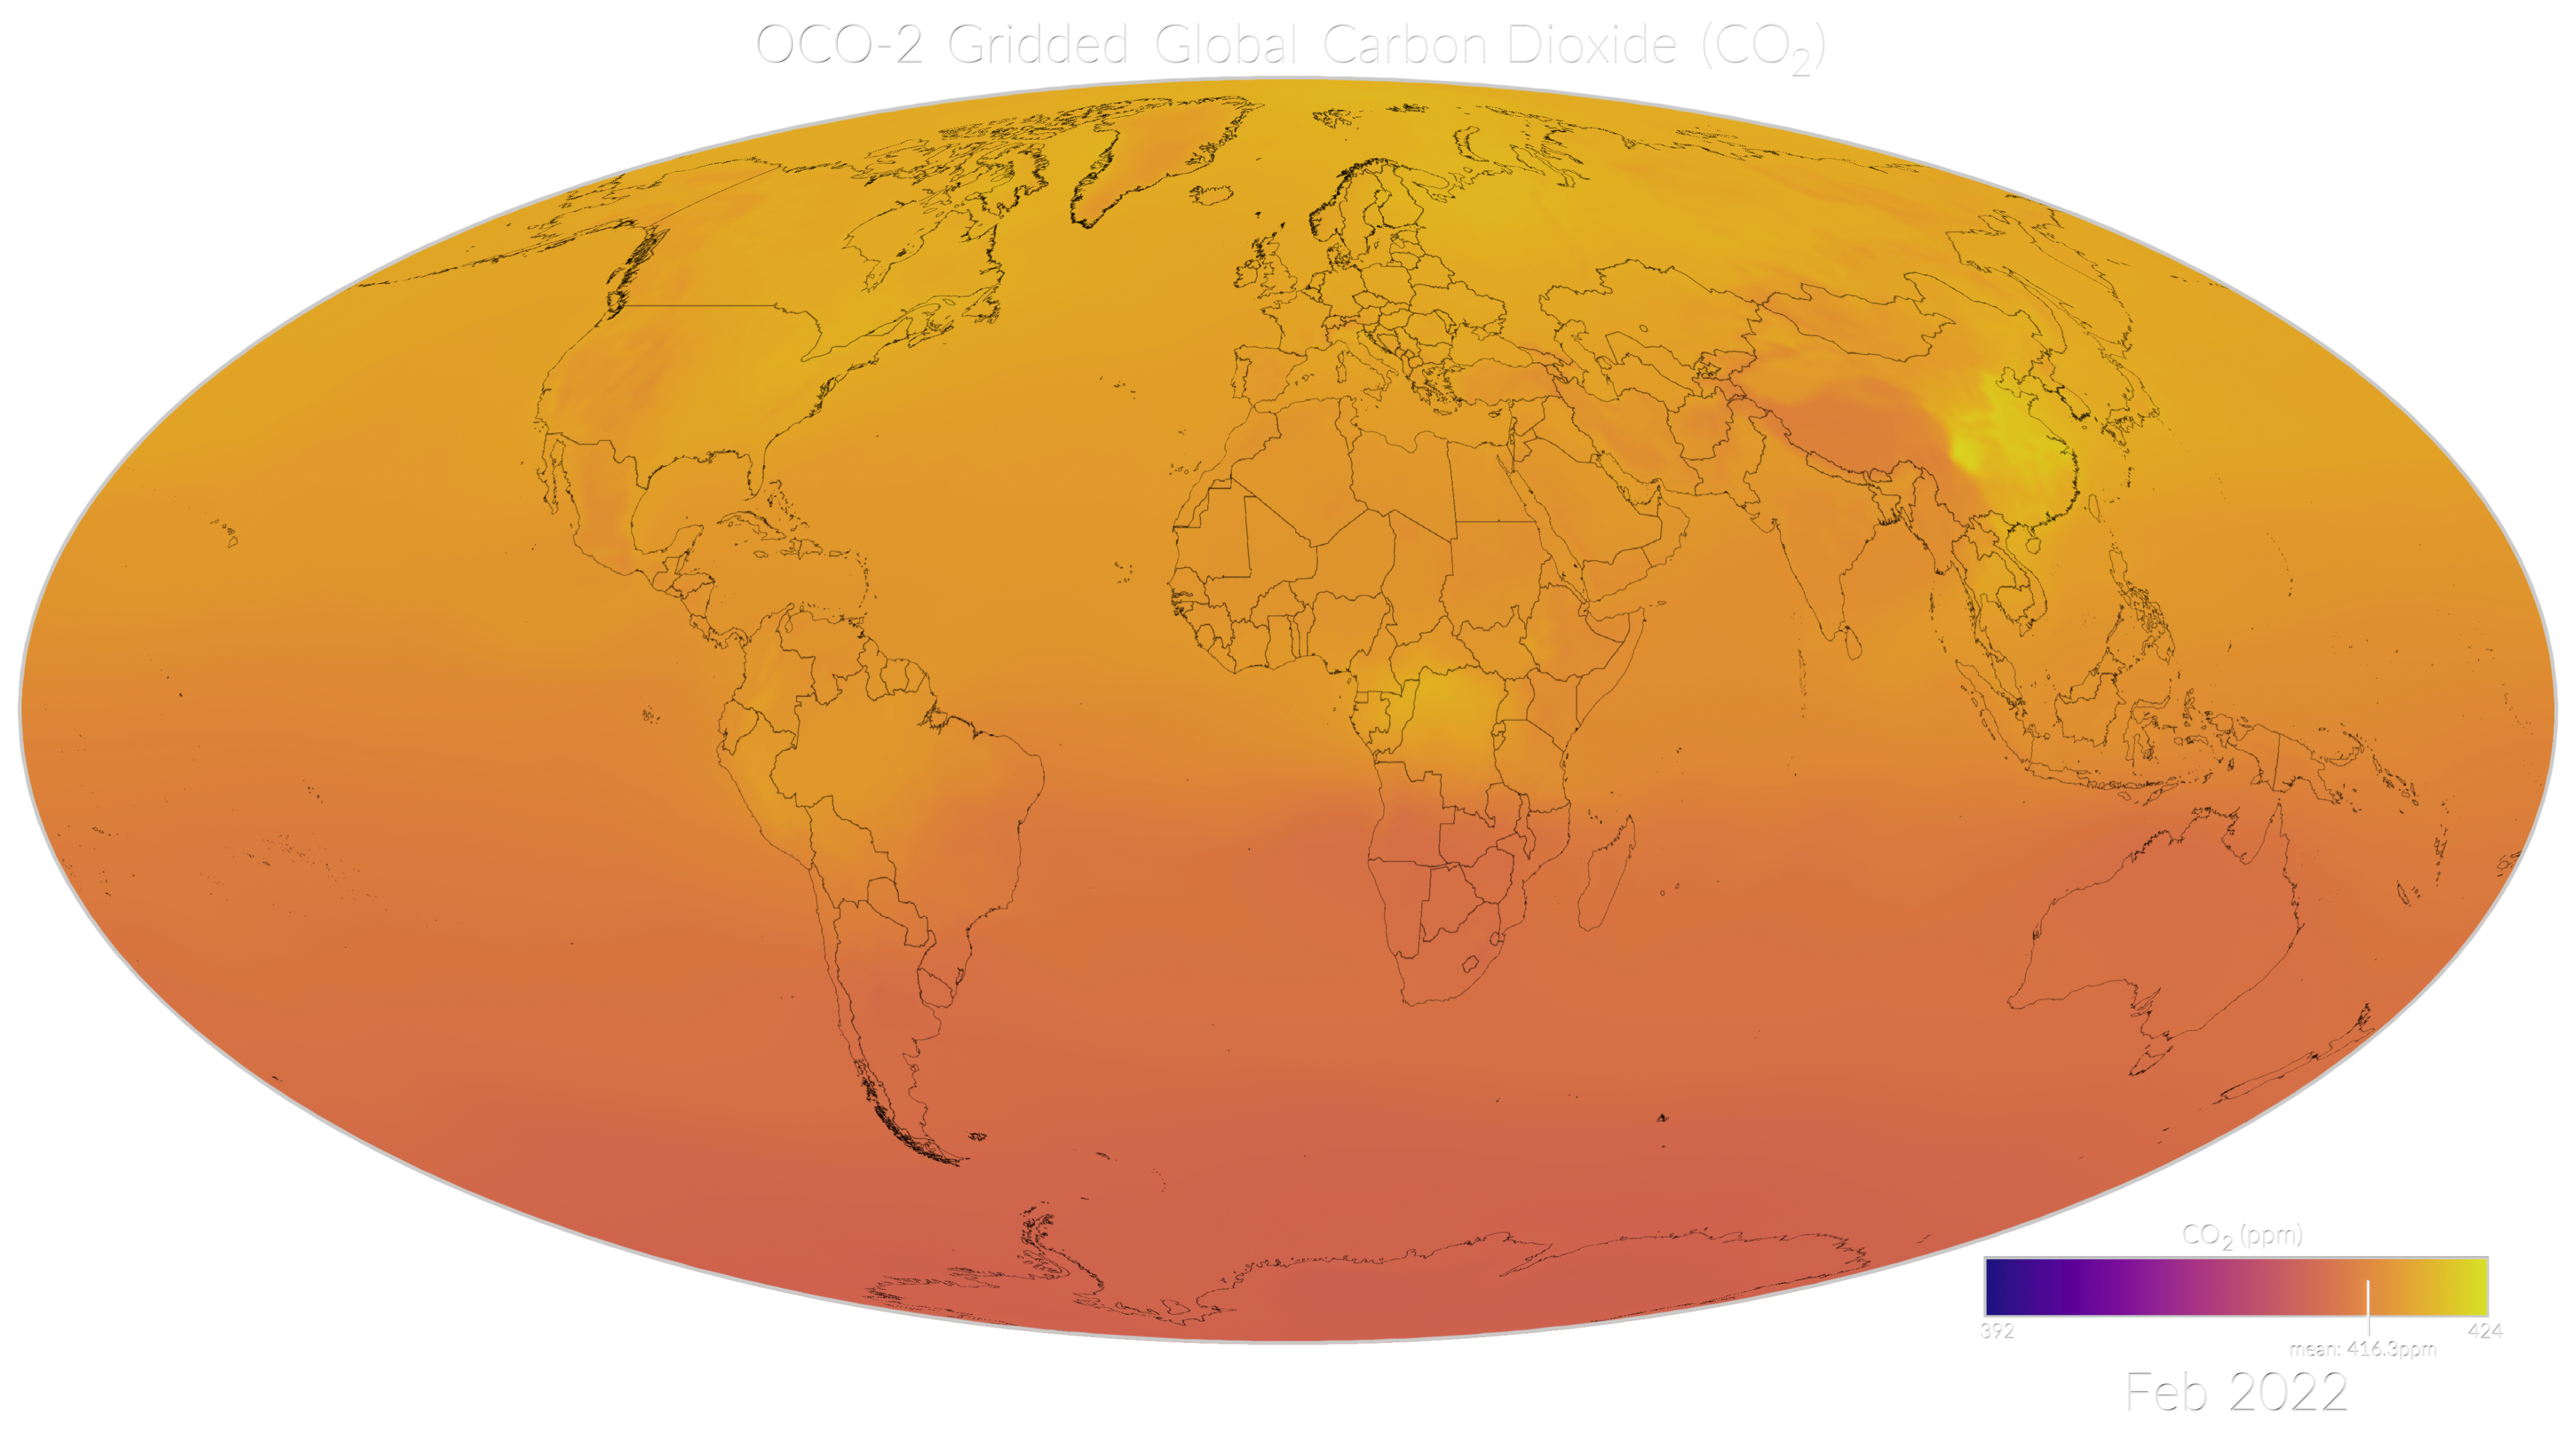
The visualizations on this page feature the Gridded Monthly OCO-2 Carbon Dioxide assimilated dataset and demonstrate the global distribution and variation of carbon dioxide in the atmosphere for the period January 2015-February 2022. One obvious feature that we see in the data visualization is a continual increase in carbon dioxide with time, as seen in the shift in the color of the map from dark purple towards light yellow as time progresses. Another feature is the seasonal variation of carbon dioxide in the northern hemisphere, which is governed by the growth cycle of plants. This can be seen as a pulsing in the colors, with a shift towards lighter colors starting in April/May each year and a shift towards darker as the end of each growing season passes into winter. The seasonal cycle is more pronounced in the northern hemisphere than the southern hemisphere since most of the land mass is in the north.
The visualization includes a data-driven spatial map of global carbon dioxide (CO₂) that is paired with a date legend (monthly timestep) and an animated colormap that includes the monthly global mean value of carbon dioxide from OCO-2.
The rest of this page offers visualization assets, layers in plate carrée and mollweide projections and a custom version for Science on a Sphere displays.
Assets for plate carrée projection
Assets for mollweide projection
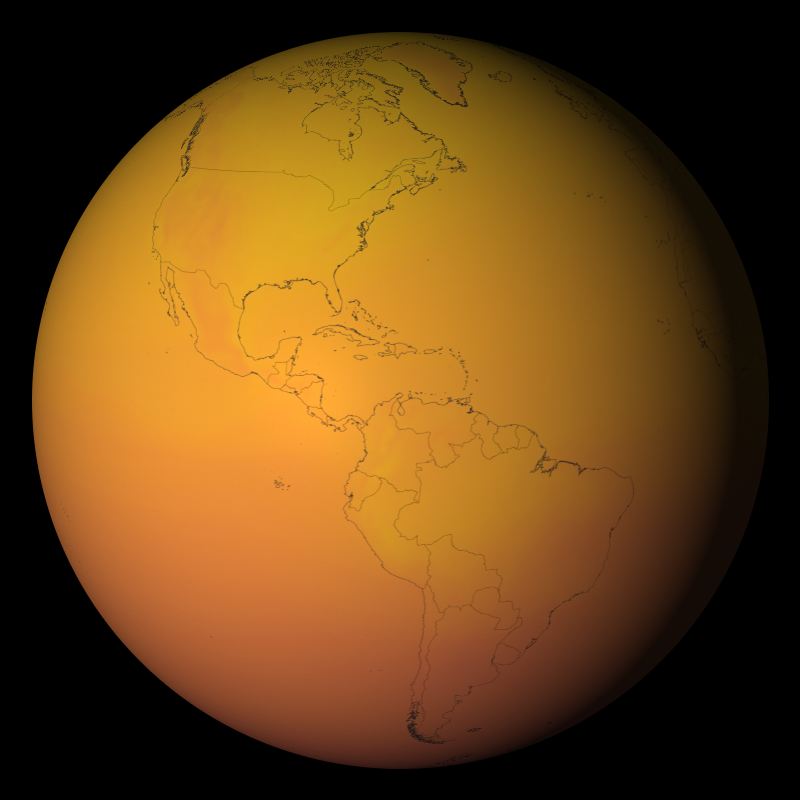
Science on a Sphere (SOS) content
The following section contains assets designed for Science On a Sphere and related displays.
SOS playlist file: playlist.sos
SOS label file: labels.txt
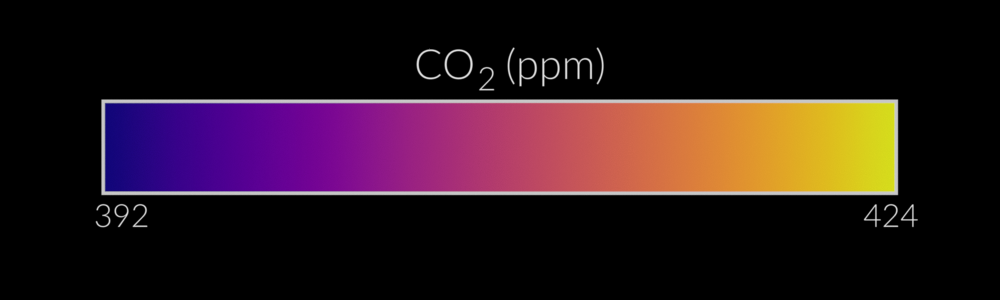
Colormap
The following section contains colormap information.

OCO-2 Gridded Global Carbon Dioxide (CO₂)
NASA’s Orbiting Carbon Observatory, 2 (OCO-2) provides the most complete dataset tracking the concentration of atmospheric carbon dioxide (CO₂), the main driver of climate change. Since its launch (July 2014), OCO-2 measures sunlight reflected from Earth’s surface to infer the dry-air column-averaged CO2 mixing ratio and provides around 100,000 cloud-free observations.
However, the OCO-2 data as observed by the on-board instrument have large data gaps in coverage due to the narrow 10-km ground track and an inability to see through clouds and aerosols. To provide a gap-filled view of Earth’s carbon cycle and atmosphere NASA’s Global and Modeling Assimilation Office (GMAO) ingests OCO-2 retrievals every 6 hours with a modeling and assimilation technique and derives the Gridded Monthly OCO-2 Carbon Dioxide/OCO-2 GEOS Level 3 product.
The visualizations on this page feature the Gridded Monthly OCO-2 Carbon Dioxide assimilated dataset and demonstrate the global distribution and variation of carbon dioxide in the atmosphere for the period January 2015-February 2022. One obvious feature that we see in the data visualization is a continual increase in carbon dioxide with time, as seen in the shift in the color of the map from dark purple towards light yellow as time progresses. Another feature is the seasonal variation of carbon dioxide in the northern hemisphere, which is governed by the growth cycle of plants. This can be seen as a pulsing in the colors, with a shift towards lighter colors starting in April/May each year and a shift towards darker as the end of each growing season passes into winter. The seasonal cycle is more pronounced in the northern hemisphere than the southern hemisphere since most of the land mass is in the north.
The visualization includes a data-driven spatial map of global carbon dioxide (CO₂) that is paired with a date legend (monthly timestep) and an animated colormap that includes the monthly global mean value of carbon dioxide from OCO-2.
The rest of this page offers visualization assets, layers in plate carrée and mollweide projections and a custom version for Science on a Sphere displays.
Assets for plate carrée projection
Assets for mollweide projection
Science on a Sphere (SOS) content
The following section contains assets designed for Science On a Sphere and related displays.
SOS playlist file: playlist.sos
SOS label file: labels.txt
Colormap
The following section contains colormap information.
Related
For More Information
Visualization Credits
Helen-Nicole Kostis (USRA): Lead Visualizer
Lesley Ott (NASA/GSFC): Lead Scientist
Laurence Schuler (ADNET Systems, Inc.): Technical Support
Ian Jones (ADNET Systems, Inc.): Technical Support
Eric Sokolowsky (Global Science and Technology, Inc.): Technical Support
Lesley Ott (NASA/GSFC): Lead Scientist
Laurence Schuler (ADNET Systems, Inc.): Technical Support
Ian Jones (ADNET Systems, Inc.): Technical Support
Eric Sokolowsky (Global Science and Technology, Inc.): Technical Support
Please give credit for this item to:
NASA's Scientific Visualization Studio
NASA's Scientific Visualization Studio
Short URL to share this page:
https://svs.gsfc.nasa.gov/5022
Mission:
Orbiting Carbon Observatory 2 (OCO-2)
Data Used:
Note: While we identify the data sets used in these visualizations, we do not store any further details nor the data sets themselves on our site.
Keywords:
DLESE >> Atmospheric science
SVS >> CO2
SVS >> Carbon Dioxide
SVS >> Climate
DLESE >> Environmental science
GCMD >> Earth Science >> Atmosphere >> Atmospheric Chemistry/Carbon and Hydrocarbon Compounds >> Carbon Dioxide
SVS >> Hyperwall
SVS >> Science On a Sphere
SVS >> Climate Change
SVS >> Atmospheric Science
NASA Science >> Earth
SVS >> 4K
NASA Earth Science Focus Areas >> Atmospheric Composition
NASA Earth Science Focus Areas >> Climate Variability and Change
NASA Earth Science Focus Areas >> Carbon Cycle and Ecosystems
GCMD keywords can be found on the Internet with the following citation: Olsen, L.M., G. Major, K. Shein, J. Scialdone, S. Ritz, T. Stevens, M. Morahan, A. Aleman, R. Vogel, S. Leicester, H. Weir, M. Meaux, S. Grebas, C.Solomon, M. Holland, T. Northcutt, R. A. Restrepo, R. Bilodeau, 2013. NASA/Global Change Master Directory (GCMD) Earth Science Keywords. Version 8.0.0.0.0
https://svs.gsfc.nasa.gov/5022
Mission:
Orbiting Carbon Observatory 2 (OCO-2)
Data Used:
Orbiting Carbon Observatory-2/OCO-2/OCO-2 GEOS Level 3 monthly, 0.5x0.625 assimilated CO2 V10r also referred to as: OCO-2 GEOS Level 3 monthly
NASA
OCO-2 GEOS (Goddard Earth Observing System) Level 3 data are produced by ingesting OCO-2 L2 retrievals every 6 hours with GEOS CoDAS, a modeling and data assimilation system maintained by NASA’s Global Modeling and Assimilation Office (GMAO). GEOS CoDAS uses a high-performance computing implementation of the Gridpoint Statistical Interpolation approach for solving the state estimation problem. GSI finds the analyzed state that minimizes the three-dimensional variational (3D-Var) cost function formulation of the state estimation problem.
Credit:
NASA
NASA
Keywords:
DLESE >> Atmospheric science
SVS >> CO2
SVS >> Carbon Dioxide
SVS >> Climate
DLESE >> Environmental science
GCMD >> Earth Science >> Atmosphere >> Atmospheric Chemistry/Carbon and Hydrocarbon Compounds >> Carbon Dioxide
SVS >> Hyperwall
SVS >> Science On a Sphere
SVS >> Climate Change
SVS >> Atmospheric Science
NASA Science >> Earth
SVS >> 4K
NASA Earth Science Focus Areas >> Atmospheric Composition
NASA Earth Science Focus Areas >> Climate Variability and Change
NASA Earth Science Focus Areas >> Carbon Cycle and Ecosystems
GCMD keywords can be found on the Internet with the following citation: Olsen, L.M., G. Major, K. Shein, J. Scialdone, S. Ritz, T. Stevens, M. Morahan, A. Aleman, R. Vogel, S. Leicester, H. Weir, M. Meaux, S. Grebas, C.Solomon, M. Holland, T. Northcutt, R. A. Restrepo, R. Bilodeau, 2013. NASA/Global Change Master Directory (GCMD) Earth Science Keywords. Version 8.0.0.0.0