|
|
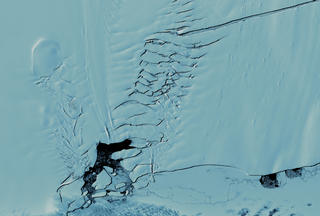
| View Oceans Movie | View Land Movie |
COLORFUL SHADOWS: INFERRING CARBON'S CYCLE
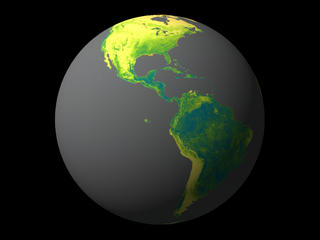
By monitoring the color of reflected light via satellite, scientists can determine how successfully plant life is photosynthesizing. A measurement of photosynthesis is essentially a measurement of successful growth, and growth means successful use of ambient carbon.
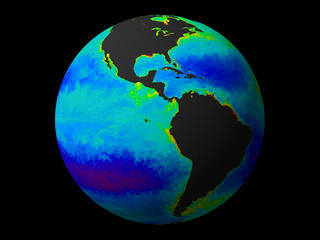
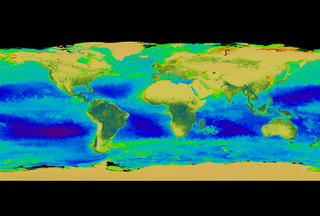
Until now, scientists have only had a continuous record of photosynthesis on land. But following three years of continual data collected by the SeaWiFS instrument, NASA has gathered the first record of photosynthetic productivity in the oceans. The process begins with a measurement of surface chlorophyll concentration.
Chlorophyll is the material that allows plant cells to convert sunlight into energy, thus enabling them to grow. It's a green substance, and thus a good indicator of overall plant health: robust forests and lush lawns and vibrant phytoplankton blooms appear green. By measuring chlorophyll concentration, scientists can determine the health and growth of plants in a given area. By extension, healthy color signatures indicate the successful use of carbon, the fundamental building block for life. In other words, lots of green indicates lots of chlorophyll; lots of chlorophyll implies healthy photosynthesis; strong photosynthesis indicates growth, and growth indicates successful use of carbon.
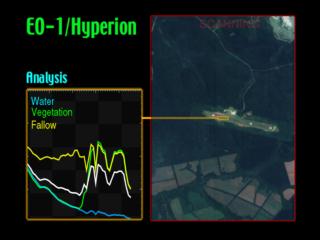
Over the past twenty years, researchers have amassed a repository of chlorophyll concentration data about the land. That measurement is called NDVI, for the Normalized Difference Vegetation Index. But chlorophyll concentration measurements regarding the ocean have remained elusive.
This release from the SeaWiFS research team marks the first continuous record of surface chlorophyll concentration in the ocean. The power of these three years of collected data can be summed up by a single word: continuity. By taking three years of continuous data as a whole, experts have been able to map trends and anomalies in the global circulation of carbon to a degree of detail than has never been done before. It is a baseline measurement to by which all future measurements will be compared.
View Movie
Special Thanks to Dr. Jon Ranson, Terra Project Scientist and Darrel Williams, Landsat Project Scientist.
Portions of this multimedia presentation includes material from Space Imaging L.P.
For further information about Landsat, Terra, EO-1, remote sensing, Earth science conducted by NASA and its partners, or related topics, check out the following web sites:
- The Landsat Gateway
- Terra: The EOS Flagship
- Earth Observing-1 Homepage
- Formation Flying
- NASA's Earth Observing System
- EOS Data and Information System (EOSDIS
- NASA's New Millennium Program
- The Remote Sensing Tutorial
- The United States Geological Survey
- The Goddard Space Flight Center
This multimedia project is the work of a dedicated team of researchers, animators, and media specialists. A companion video to this web site is available from NASA-TV. Below are a list of agencies, departments, and researchers who provided expertise and data for this production:
NOTE: All SeaWiFs images and data presented on this website are for research and educational use only. All commercial use of SeaWiFs data must be coordinated with ORBIMAGE.
Please give credit for these images to:
NASA - Goddard Space Flight Center
Scientific Visualization Studio
Television Production NASA-TV/GSFC
The SeaWiFs Project and ORBIMAGE
Content Preparation and Project Production: Michael Starobin
Last Revised: February 4, 2019 at 06:02 PM EST